Posted 11/01/2026 CPI Food at home October 2026 Odyssey
October food-at-home nowcast update: now 1.94%
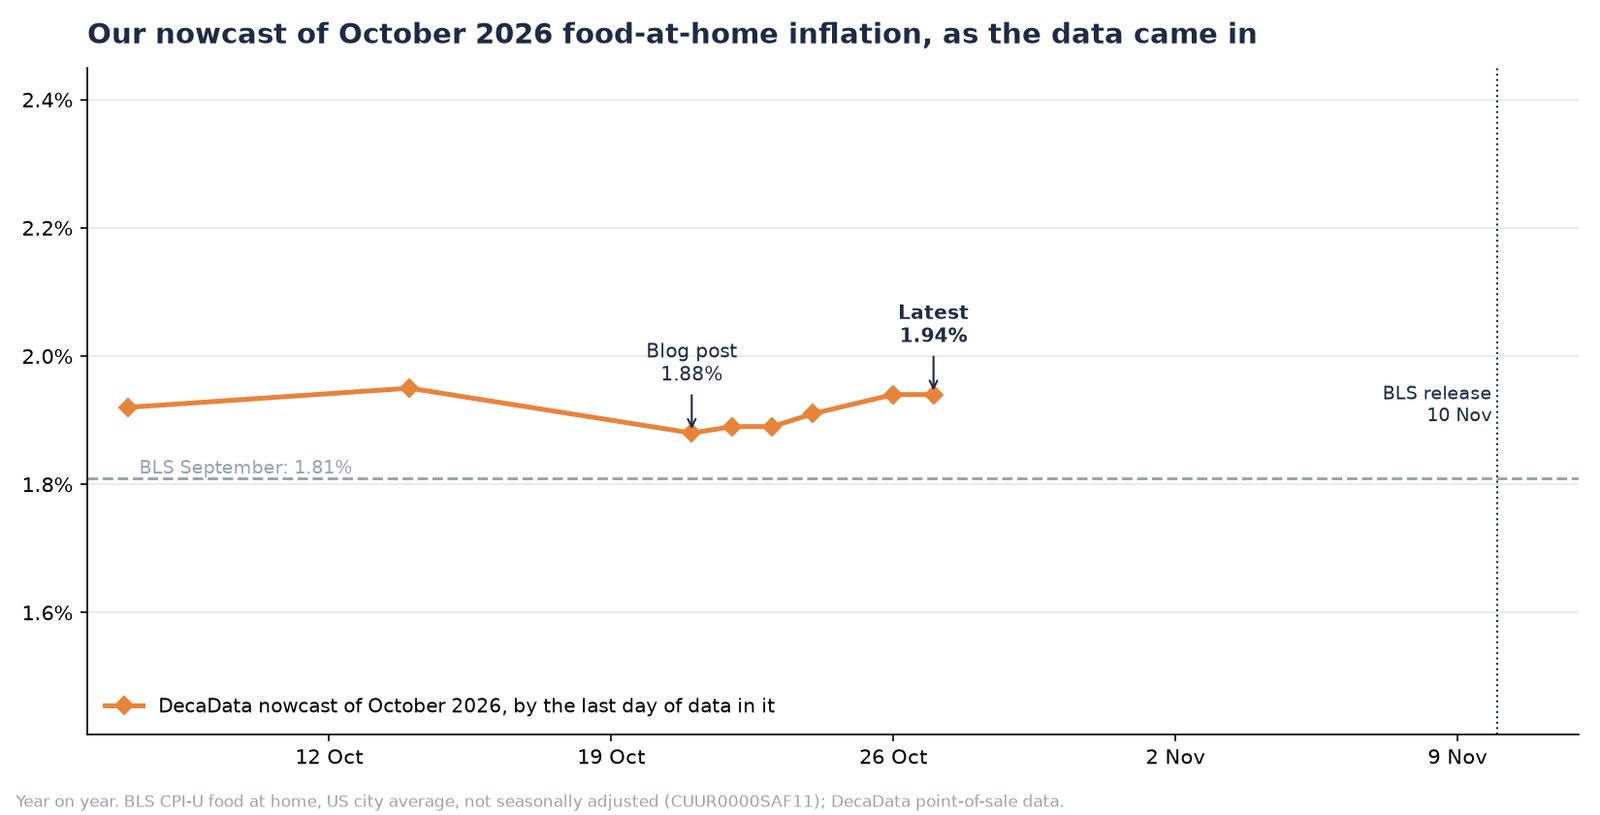
Our nowcast for October's food-at-home inflation is now 1.94% year on year, on data to 27 October. When we first published it, on data to 21 October, it stood at 1.88%, which we rounded to 1.9%. BLS publishes October's CPI on Tuesday 10 November.
The chart above shows each day's nowcast of October as more of the month's data came in. It has stayed in a narrow band, between 1.88% and 1.95%, and above BLS's September figure of 1.81%.
What moved
| Data through | Nowcast of October |
|---|---|
| 7 October | 1.92% |
| 14 October | 1.95% |
| 21 October (first post) | 1.88% |
| 22 October | 1.89% |
| 23 October | 1.89% |
| 24 October | 1.91% |
| 26 October | 1.94% |
| 27 October | 1.94% |
The rise over the past week follows prices at the tills. Our own index for the high-low chains in our panel is up 2.3% on a year earlier on data to 27 October, higher than when we first wrote. The nowcast moves less than our index because it starts from BLS's last published figure and counts our change fully only in the items where our data has tracked BLS well.
27 October is the latest day every chain in our panel has reported, so the nowcast will keep updating as the rest of the month comes in.
What happens on 10 November
When BLS publishes, we will score the nowcast against it, as we have for every month since July 2025. Over those 14 months it missed BLS by 0.32 points on average, against 0.37 for simply repeating last month's figure. That is a modest edge, and October is one more test of it.
To follow the nowcast as it updates, or for a sample of the till data behind it, get in touch.
© DecaData • Terms • @Deca_Data on X • • Privacy opt-out