Posted 10/26/2026 CPI Food at home October 2026 Odyssey
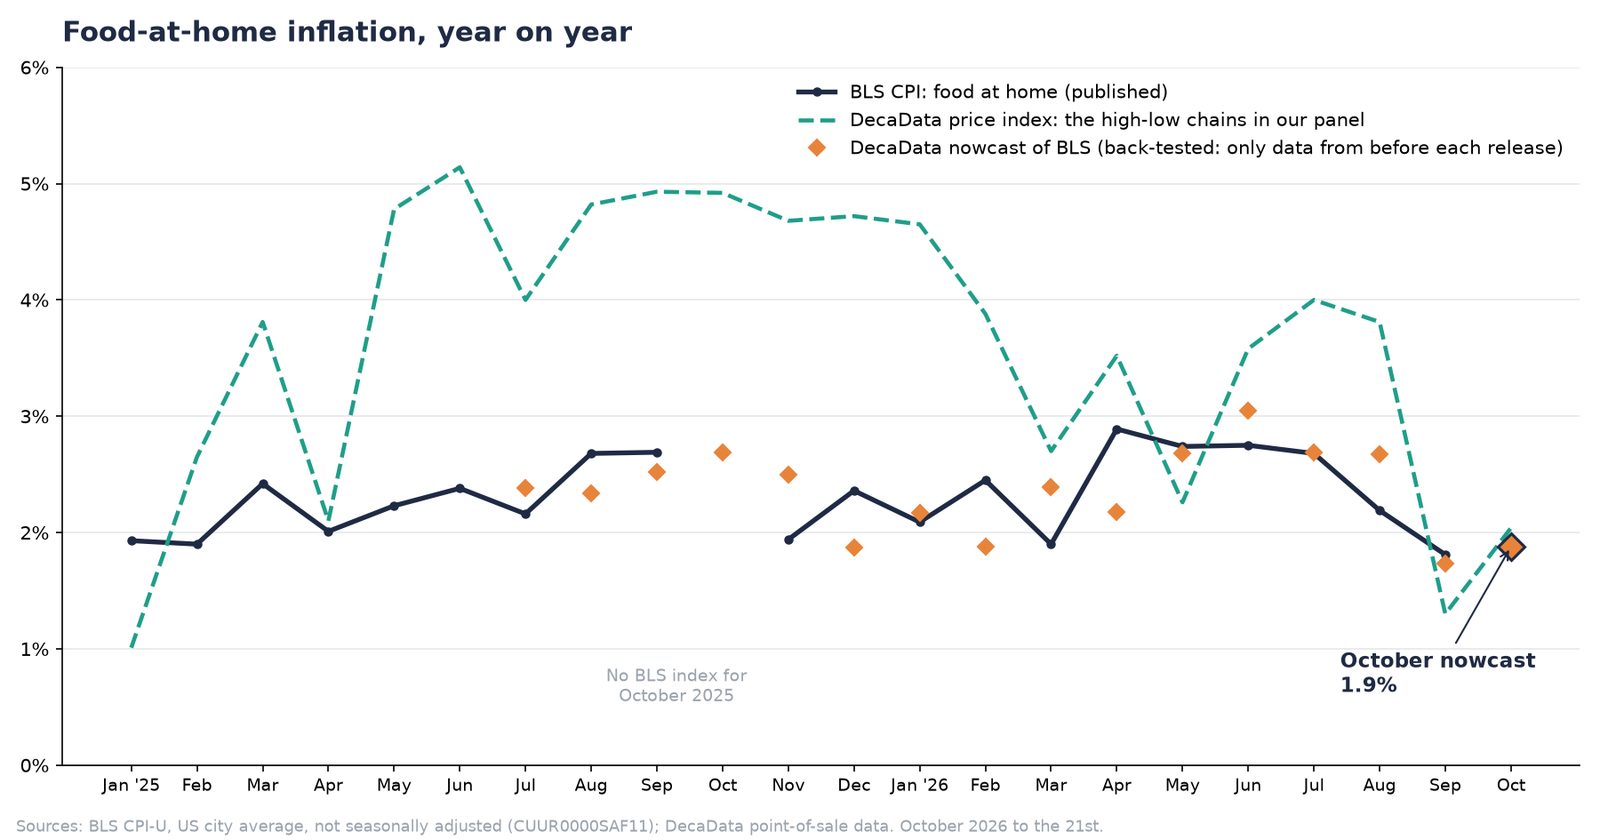
October food-at-home inflation: our nowcast is 1.9%
Our nowcast for October's food-at-home inflation is 1.9% year on year, a touch above September's 1.8%. BLS publishes October's CPI around 12 November. Below is how we get there, how it has done when tested on the months already published, and what prices at the tills are doing that the national figure doesn't show.
Two numbers from the same tills
From the transaction logs of the high-low grocery chains in our panel, we build two things.
Our own price index. Every product sold in the same store in both periods, at what shoppers actually paid, weighted by what they spent on it. Products are grouped into BLS's own food-at-home items (ground beef, coffee, eggs and so on) and combined with BLS's weights. Fresh meat and produce sold by weight are priced per pound. In promotion-heavy packaged aisles (soft drinks, snacks, cereal, condiments) we use each product's most common price in the month, which is the regular price a high-low chain holds between promotions.
A nowcast of BLS's own figure. This starts from BLS's latest published number and adds what our data says has changed since, item by item. Items where our data has tracked BLS well count fully. Items where it hasn't fall back to BLS's last figure.
Our chains run hotter than the national sample
Since January 2025, prices at these chains have risen faster than BLS's food-at-home index, by 1.3 points a year on average. The gap was 1.6 points in 2025 and has narrowed to 0.9 in 2026.
We checked this was not a quirk of method. Measuring prices paid rather than shelf prices, the weighting formula, average against most common price, and comparing with BLS's regional indexes all left the gap in place. The likeliest reason is the format. BLS's sample includes everyday-low-price retailers, which hold their prices below high-low competitors, and the chains in our panel are high-low grocers.
| Year on year, September 2026 | DecaData index | BLS CPI |
|---|---|---|
| Cereals & bakery products | 1.4% | 2.1% |
| Meats, poultry, fish & eggs | 0.3% | 0.3% |
| Dairy & related products | (0.8%) | (0.7%) |
| Fruits & vegetables | 4.3% | 3.7% |
| Nonalcoholic beverages | 2.7% | 3.8% |
| Other food at home | 0.6% | 1.8% |
| Food at home | 1.3% | 1.8% |
How the nowcast has done
We tested the nowcast on every month from July 2025 to September 2026. Each month's figure uses only the data that existed before BLS published it. The yardstick is the simplest forecast there is: assume this month will match last month.
Over those 14 months, the nowcast missed BLS by 0.32 points on average, against 0.37 for repeating last month. It was closer in 9 of the 14 months. That is a modest edge, measured over a short run, and we will keep scoring it each month.
| Food at home, year on year | Nowcast | BLS | Last month's BLS |
|---|---|---|---|
| April 2026 | 2.2% | 2.9% | 1.9% |
| May 2026 | 2.7% | 2.7% | 2.9% |
| June 2026 | 3.0% | 2.7% | 2.7% |
| July 2026 | 2.7% | 2.7% | 2.7% |
| August 2026 | 2.7% | 2.2% | 2.7% |
| September 2026 | 1.7% | 1.8% | 2.2% |
| October 2026 | 1.9% | out ~12 Nov | 1.8% |
The nowcast is strongest where our data is strongest. Beef, eggs, tomatoes and butter track BLS closely at our tills. Seafood counters, where promotions swing prices by 20% or more from one year to the next, do not, so there the nowcast leans on BLS's last figure.
What the tills show for October
On data to 21 October, prices at these chains are up 2.0% on a year earlier, against 1.3% in September. Fruits and vegetables lead, at 6.8%. Beverages are up 3.3% and cereals and bakery 1.5%. Meats are slightly down, at (0.4%), with eggs still 18% cheaper than a year ago.
Methodology
- Prices: what shoppers paid, discounts included, per item and per store, in the same stores in both periods.
- Weights: each product's share of spending within its BLS item, averaged over the two periods (a Törnqvist index), and BLS's relative importance across items.
- Fresh meat and produce: priced per pound.
- Promotion-heavy aisles: each product's most common price in the month.
- Excluded: price changes beyond a factor of three, which are usually a pack-size or coding change.
- The nowcast: BLS's latest figure plus, for each BLS item, a share of our change for that item. Each share is fitted only on months that came before.
- BLS series: CPI-U, US city average, not seasonally adjusted. BLS published no index for October 2025.
© DecaData • Terms • @Deca_Data on X • • Privacy opt-out